Adding Logback and Gradle to Groovy-Spock Project

This article will be a follow up of the article API Automation with Groovy and Spock where we discussed how we can automate REST APIs and implement test cases in behavior driven and data driven approach. In this article we will discuss how to add logback and gradle to our API automation project and their corresponding benefits.
Adding Logback:
We build an automation project to strengthen our testing process. Troubleshooting is an integral part of our STLC process. Adding logback to our automation project can be a viable medium for troubleshooting. We can play around with different types of log level and adjust logging request and responses according to our need so that we can analyze the errors occurring in our automation test suite.
If we consider a spring-boot project, we add the logging configuration in an xml file named logback and we place it under the resources folder. In our project we will also place our file in the resources folder. The difference is we will create a logback file with groovy extension instead of an xml extension. The mode of logging will be derived from the package:
ch.qos.logback
Our logback file will contain the pattern we will use to print our logs, the different policies for file rolling and time rolling. We will also mention the log level in threshold filter. These policies will go into appender tag. We are going to add appender for console logging and file logging.
We will be needing to import the following libraries based on the aforementioned contents:
import ch.qos.logback.classic.encoder.PatternLayoutEncoder
import ch.qos.logback.classic.filter.ThresholdFilter
import ch.qos.logback.core.ConsoleAppender
import ch.qos.logback.core.rolling.RollingFileAppender
import ch.qos.logback.core.rolling.TimeBasedRollingPolicy
Now lets see the body of our logback.groovy file:
appender("CONSOLE", ConsoleAppender) {
    filter(ThresholdFilter) {
        level = INFO
    }
    encoder(PatternLayoutEncoder) {
        pattern = "%date [%thread] %-5level %logger - %X %msg %n"
    }
}
appender("FILE", RollingFileAppender) {
    file = "./log/api-automation.log"
    rollingPolicy(TimeBasedRollingPolicy) {
        fileNamePattern = "./log/api-automation-%d{yyyy-MM-dd}.log"
    }
    filter(ThresholdFilter) {
        level = INFO
    }
    encoder(PatternLayoutEncoder) {
        pattern = "%date [%-17thread] %-5level %-45logger{45}  %msg %n"
    }
}
logger("our.base.package.name", INFO, ["FILE"])
root(INFO, ["CONSOLE"])
At first, we have added policy for console logging and then for file logging. We can assign any level, i.e: INFO, DEBUG, WARN, ERROR as per our need. The pattern we have defined will print the date, thread name, log level and our desired message in the log. In the time based rolling policy, we hav just mentioned a policy for file management on every calendar date. If required, we can define policy based on maximum file size for each log file or based on a time policy. If we want to add the class name where the logger has been invoked, we can add the base package name of our project at the end of our logback.groovy file.
Now lets check how we can initialize the logger functionality in our class files. Before proceeding with logging we need to import the following dependencies:
import org.slf4j.Logger
import org.slf4j.LoggerFactory
Now that we have added the dependencies we can initiate the logger class like this:
private static Logger logger = LoggerFactory.getLogger(RequestHelper.class)
Lets say we want to log our request and response body from each API call. So we modify our API Client methods like this:
static def loginRequest(String userName, String password) {
    def response
    def path = "/api/user-login"
    def request = [
            username: userName,
            password: password
    ]

    logger.info("\nRequest URL: " + restClient.getUri().toString() + path + "\nRequest data : " + JsonOutput.toJson(request))

    def correlationHeader = new HeaderBuilder()
        .addAppType("Android")
        .addAppCode("01")
        .build()

    response = restClient.post(
        path: path,
        requestContentType: "application/json",
        headers: correlationHeader,
        body: request
    )

    logger.info("\nResponse data : " + JsonOutput.toJson(response.data))

    return response
}
Now when we execute our spec class a log file will be generated in our specified directory. Here is a sample preview:
2021-06-01 11:17:37,057 [Test worker      ] INFO  c.k.endtoendtest.configuration.Configuration  [correlationId=] [mpaId=] [cardId=] [email=] Load Properties
2021-06-01 11:17:37,099 [Test worker      ] INFO  c.k.endtoendtest.specification.APITestSpec    [correlationId=] [mpaId=] [cardId=] [email=] Setup Spec method executed...
2021-06-01 11:17:37,132 [Test worker      ] INFO  c.k.endtoendtest.specification.APITestSpec    [correlationId=] [mpaId=] [cardId=] [email=]

============================== Scenario - (001) Get User Details ==============================

2021-06-01 11:17:37,618 [Test worker      ] INFO  c.k.e.h.RequestHelper
Request URL: http://HOST_URL/api/user/get-user-info
Request data : {"username":"user@user.com"}
2021-06-01 11:17:38,314 [Test worker      ] INFO  c.k.e.h.RequestHelper
Response data : {"accountInfo":{"userCode":"10","mobileNo":"01******123","registeredAt":1560138136852,"userId":91125,"userType":"AG"},"executionStatus":{"statusCodeData":{"message":"","reason":""},"statusType":"EXECUTED_SUCCESS"},"userInfo":{"accessChannels":"101","customerSegment":"BASIC","dateOfBirth":"1998-02-15","name":"Mr. Tester","photoId":"11******99","photoIdType":"ID","status":"ACTIVE"}}
2021-06-01 11:17:38,332 [Test worker      ] INFO  c.k.endtoendtest.specification.APITestSpec

============================== Scenario - (002) User Login ==============================

2021-06-01 11:17:38,336 [Test worker      ] INFO  c.k.e.h.RequestHelper
Request URL: http://HOST_URL/api/user-login
Request data : {"username":"username":"user@user.com","password":"ABCD@123abc"}
2021-06-01 11:17:38,679 [Test worker      ] INFO  c.k.e.h.RequestHelper
Response data for user login: {"customerType":"BASIC","status":"ACTIVE,"userId":"91125","userType":"REGULAR"}
Advantages of adding logback:
- Adding log to the project will help a great deal with troubleshooting.
- We can get a proper view of our test case execution and comparison of expected and actual results through logging.
Benefits of a Gradle Project:
Adding a build tool like gradle gives a lot of flexibility in our projects. For example, we do not need to handle the required dependencies manually anymore. We just add the dependency list in our build.gradle file. For our API automation project the dependency part of build.gradle file will look somewhat like this:
dependencies {
    compile 'org.codehaus.groovy:groovy-all:2.3.11'
    testCompile group: 'junit', name: 'junit', version: '4.12'
    testCompile "org.spockframework:spock-core:1.0-groovy-2.4"
    testCompile "org.hamcrest:hamcrest-core:1.3"
    testCompile "cglib:cglib-nodep:3.1"
    testCompile "org.codehaus.groovy.modules.http-builder:http-builder:0.7"
    compile "org.codehaus.gpars:gpars:1.2.1"
    compile group: 'org.slf4j', name: 'slf4j-api', version: '1.7.28'
    testCompile group: 'ch.qos.logback', name: 'logback-classic', version: '0.9.26'
}
Apart from the easy resolution for dependency adding, another benefit of adding a build tool is that we can use custom commands to run our project in one go. We need to define gradle task in build.gradle file and we can use the commands to execute our project.
The benefit of gradle that comes in most handy in any test framework is the reporting module of gradle. After finishing execution, gradle creates an HTML report file that contains the result of our tests. Lets see a sample report where all of our test cases have passed:
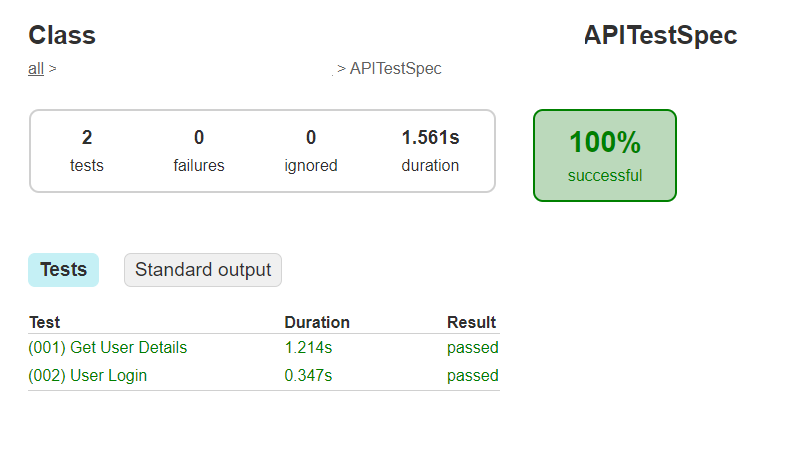
Image 1: A Sample Gradle HTML Report
The test report contains the test case names, time required to execute, passing rate and other useful parameters. Now lets check what does the report file contain if a test case fails:
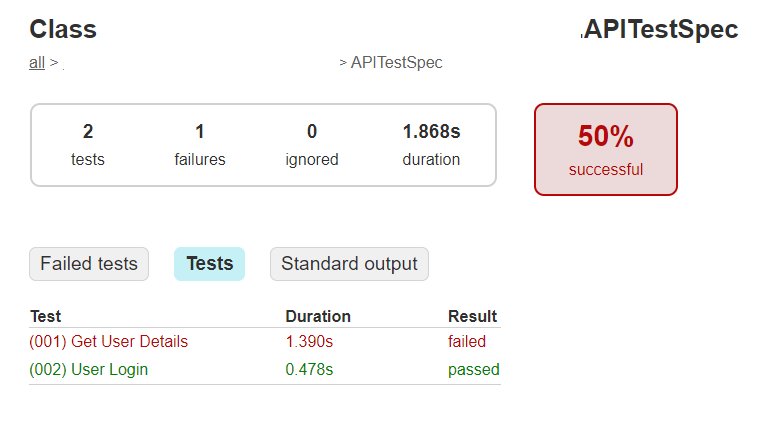
Image 2: A Sample Gradle HTML Report with Failed Test
In the report failed cases are marked in red font. Percentage of successful test cases is also updated. Lets check the Failed Tests tab:
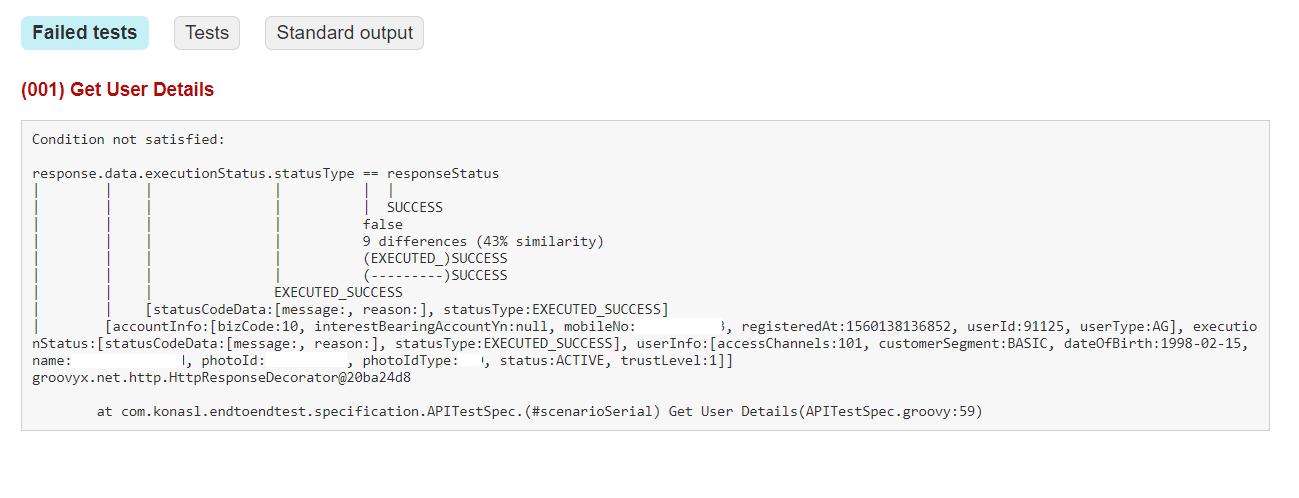
Image 3: Details of a Failed Test
The failed test tab contains the detailed reasons of the cases which failed. The beauty of gradle reporting is, it indicates where in our then clause the test case failed. The matching percentage in then clause is also mentioned. The exception or error is also specified along with the class name and line number of error occurrence.
This sums up how to add logback to our automation project and what benefits we can avail if we build our project as a gradle project.
Here is the link to our automation project: api-automation-with-spock


